Instruments
Instruments is a powerful and flexible performance-analysis and testing tool that’s part of the Xcode toolset. It’s designed to help you profile your iOS, watchOS, tvOS, and macOS apps, processes, and devices in order to better understand and optimize their behavior and performance. Incorporating Instruments into your workflow from the beginning of the app development process can save you time later by helping you find issues early in the development cycle. In Instruments, you use specialized tools, known as instruments, to trace different aspects of your apps, processes, and devices over time. Instruments collect data as it profiles, and presents the results to you in detail for analysis.
For example, your app may exhibit large memory growth caused by multiple open network connections. By using the Allocations and Connections instruments together, you can identify connections that are not closing and thus resulting in rapid memory growth.
By using Instruments effectively, you can:
- Examine the behavior of one or more apps or processes
- Examine device-specific features, such as Wi-Fi and Bluetooth
- Perform profiling in a simulator or on a physical device
- Track down problems in your source code
- Conduct performance analysis on your app
- Find memory problems in your app, such as leaks, abandoned memory, and zombies
- Identify ways to optimize your app for greater power efficiency
- Perform general system-level troubleshooting
- Save instrument configurations as templates
Although it’s embedded within and may be used with Xcode, Instruments is a separate app, which may be used independently as needed.Unlike other performance and debugging tools, Instruments allows you to gather widely disparate types of data and view them side by side. This makes it easier to identify trends that might otherwise be overlooked.
Find abandoned memory(Leaks) :
The Allocations profiling template uses the Allocations and VM Tracker instruments to measure general and virtual memory usage in your app. However, to track down abandoned memory that’s been allocated but isn’t needed again, focus strictly on the Allocations instrument. This instrument measures heap memory usage and tracks allocations, including specific object allocations by class.
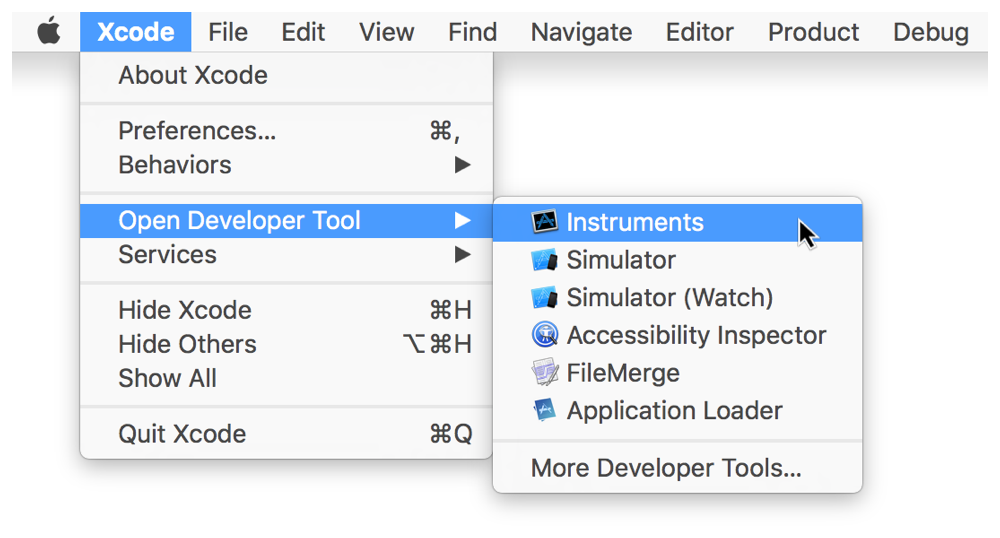
- Launch Instruments.
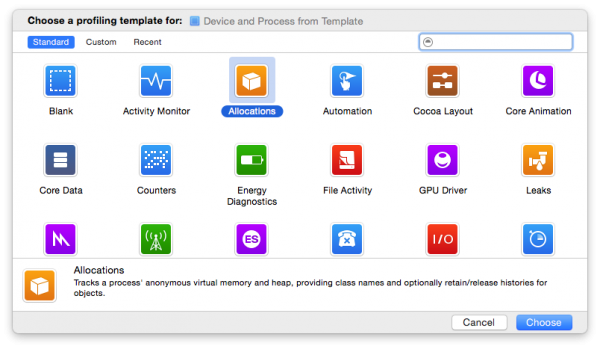
- In the profiling template selection dialog that appears, click Allocations.
- Choose your device and app from the target device and process lists.
- Click Choose to create a trace document.
- Click the Allocations instrument in the timeline pane.
- The Mark Generations button appears in the filter and configuration bar at the bottom of the detail pane.
- Click the Record button in the toolbar (or press Command-R) to begin recording.
-
Perform a short sequence of repeatable actions in your app.
-
In order to accurately generate trends, this should be a set of actions that starts and finishes with the app in the same state.
- Click the Mark Generation button in the filter and configuration bar.
- A flag appears in the track pane to identify the generation.
-
A list of generations you’ve marked is shown in the detail pane. Each generation includes a list of allocations that have occurred since the previous generation.
-
You can also mark generations after you’re done recording by dragging the inspection head in the track pane’s timeline to the desired location and clicking Mark Generation.
-
Perform steps 8 and 9 several times while monitoring the detail pane until you see whether a memory is growing without limit.
-
Important: During the first few iterations, extra allocations may occur due to caching. Therefore, it is important to create a few initial generations for the purpose of establishing a baseline. Then, create additional generations for true analysis.
-
Click the Stop button in the toolbar (or press Command-R again) when you’re ready to stop recording.
- Scan through the generations in the detail pane and find one that seems representative of repeated memory growth.
-
The Growth and # Persistent columns tell you how much additional memory and how many allocations have occurred since the previous generation. If your app returns to its original state after an operation, you shouldn’t expect there to be growth from generation to generation.
- Click the disclosure triangle () of a generation to display new objects that have been allocated since the prior generation.
- Look for objects that are persisting. If you identify one, click the disclosure triangle () to display its instances.
- Select an object instance.
- Press Command-3 to display a stack trace for the selected instance in the extended detail area of the inspector.
- This stack trace provides the complete list of method calls responsible allocating the instance.

- Click the Collapse button () in the extended detail area to hide system calls in the stack trace. This makes it easier to locate your app’s methods.
- Calls made by your app are colored black and preceded by a user code icon ().
- Control-click on an entry in the detail pane, in the popover that appears choose to Reveal in Xcode to show the source in Xcode.
- Determine whether the allocation is useful. If it’s not, it’s abandoned memory that needs to be resolved.
Measure the energy impact of an iOS device (Energy Log):
Use the Energy Log profiling template to monitor a variety of factors that affect energy usage on an iOS device, including CPU activity, network activity, screen brightness, and more. Identify the areas where usage is highest, and see if you can reduce impact in those areas. For example, you might find opportunities to defer discretionary or network tasks until more energy efficient times, such as when the device is plugged in or on Wi-Fi.
- Launch Instruments, and create a new trace document that targets your device and app with the Energy Log profiling template.
- Click the Record button ( ), or press Command-R, to begin recording a trace.

-
For best results, consider performing the trace wirelessly. Doing so allows you to more accurately profile the device in a real-world scenario—on battery power, with accelerometers, and so on. To learn how to enable wireless device profiling, seeEnable an iOS device for wireless profiling.
- Use the app normally on the device, while allowing energy data to be collected.
- Click the Stop button, or press Command-R again, when complete.
-
Go through the collected data and look for spikes or areas of otherwise unusual or unexpected activity. Then, review the code in these areas to determine whether improvements can be made.
Track CPU core and thread use (Allocations):
The Time Profiler profiling template uses the Time Profiler instrument to perform low-overhead, a time-based sampling of processes running on the system’s CPUs. The more effectively multiple cores and threads are used over time, the better an app’s performance. The CPU and thread strategies in the Time Profiler instrument show how well an app utilizes cores and threads.
- Launch Instruments.
- In the profiling template selection dialog that appears, click Time Profiler.
- Choose your device and app from the target device and process lists.
- Click Choose to create a trace document.
- Click the Record button () in the toolbar (or press Command-R) to begin recording.
- Use your app or the system normally.
- Click the Stop button (), or press Command-R again, when complete.
- Click the CPU or threads strategy button in the trace document toolbar.
- Examine the collected data.

Use the CPU strategy usage view to compare core usage over given time periods. Effective core concurrency improves an app’s performance. Look for unbalanced core usage. If a single core has areas of heavy usage while other cores remain quiet, that can indicate areas that need greater optimization. When zoomed out, the activity may appear to be occurring on multiple threads, but a closer inspection may reveal otherwise. Therefore, be sure to zoom in on the track pane when examining core usage.
Use the threads strategy view to examine your app’s use of threads when performing work. Large amounts of work on the main thread can make your app’s user interface unresponsive or slow. Whenever possible, work should be moved off the main thread.